Manage, compare, analyze and automate your air quality in one place.
The corona pandemic has shown us how important fresh and healthy air is. Regular ventilation or ventilating rooms with ventilation systems reduces aerosols in the air and prevents the CO2 concentration from rising to a tiring level.
But how can we see the invisible? How do we know when we should or even have to ventilate?
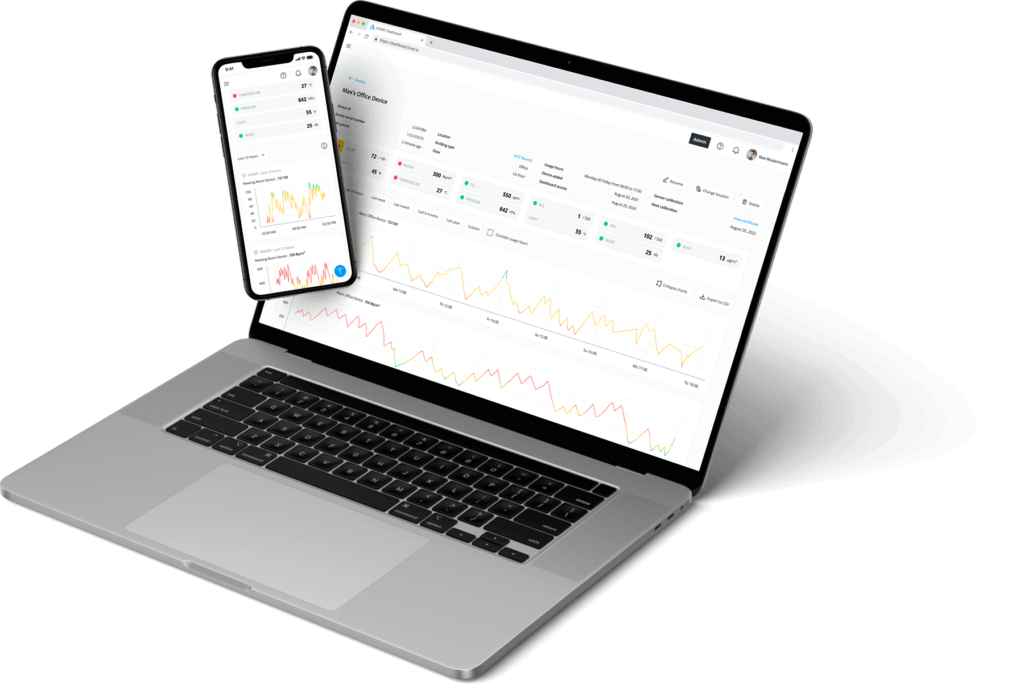
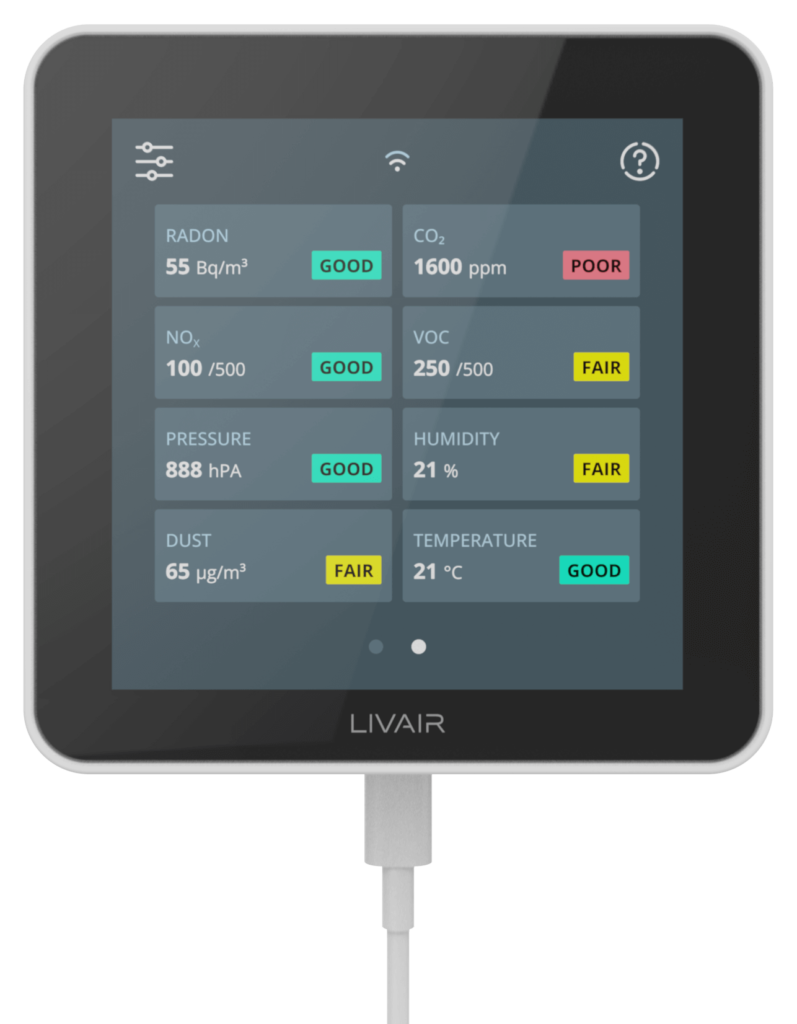
LivAir gives you a complete overview of your air quality. With the large, simple traffic light display, you know exactly when the air in your environment is depleted.

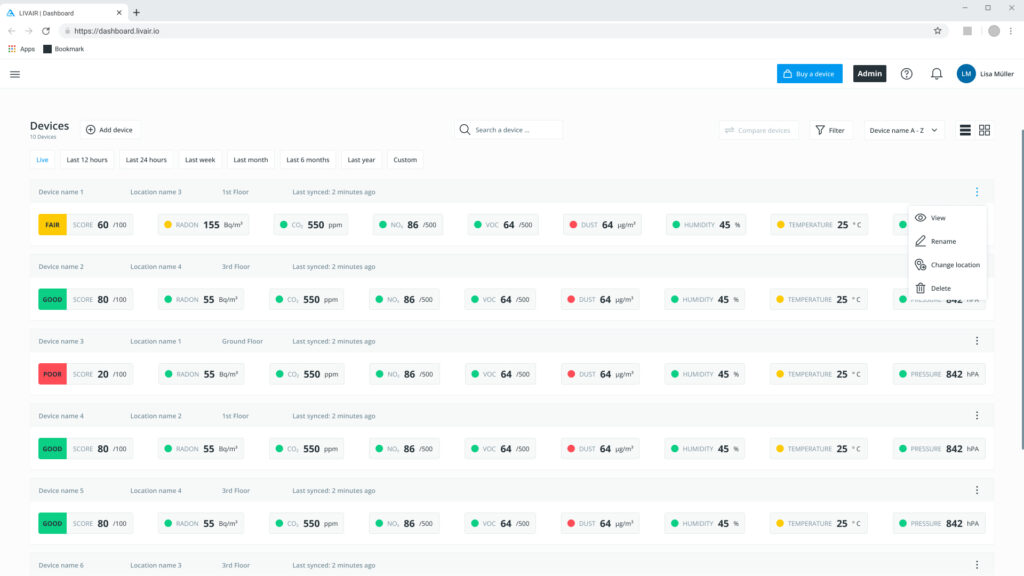
View, manage and compare all your devices and locations in one portal
Assign different access rights to users so that they can only perform certain actions
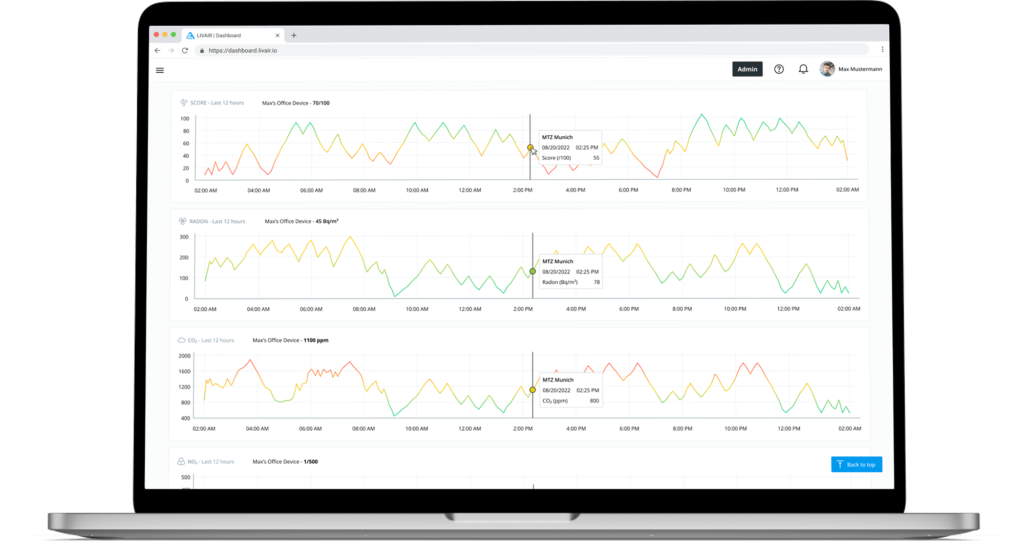
Track your data over months and compare the present with the past
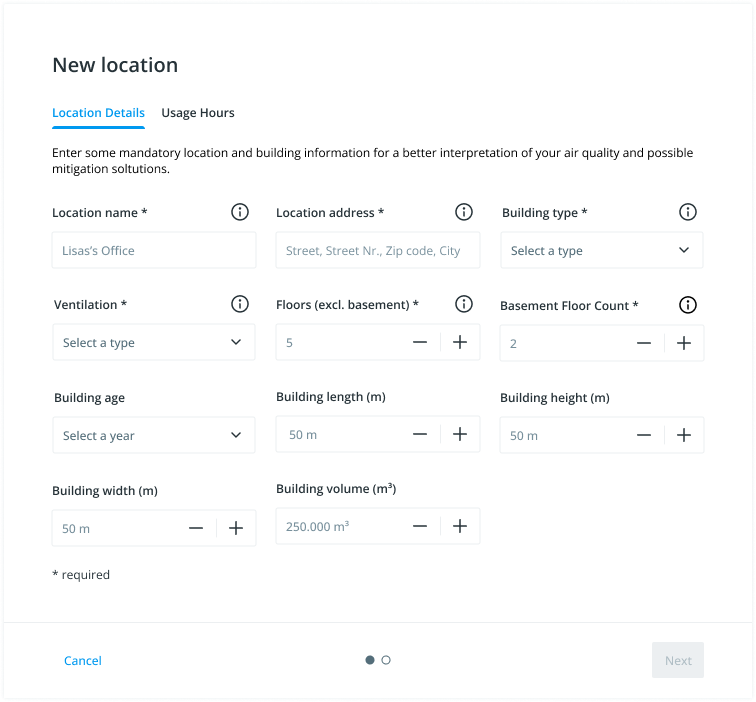
Manage your company locations and get more value out of them
Enter the usage times to make even more precise statements about the data
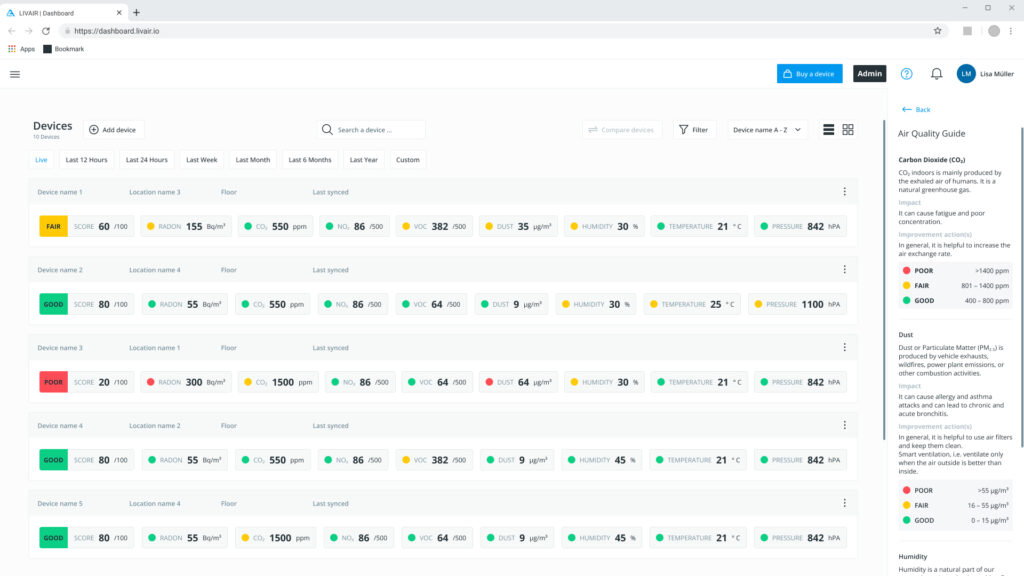
Compare your data with the measurement ranges in our air quality guide to see where you stand
The intelligent web application that makes air visible. Manage, compare, analyze and automate your air in a single portal. Manage an unlimited number of devices within your organization account to have full control over all your rooms.
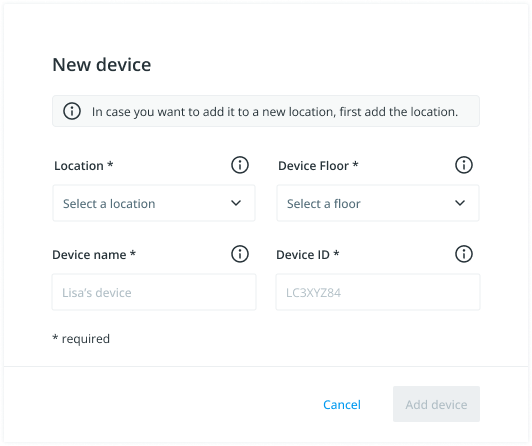
By assigning the devices to specific locations, you can accurately replicate your company with multiple locations and buildings and analyze and evaluate the individual locations and buildings and take action if necessary.
Once you have collected enough data about a room, you can dig deeper - when exactly do negative readings occur, how are they related? The best way to see this is in the graphical representation of the data by using the synchronized sensor diagrams and setting the corresponding time filter.


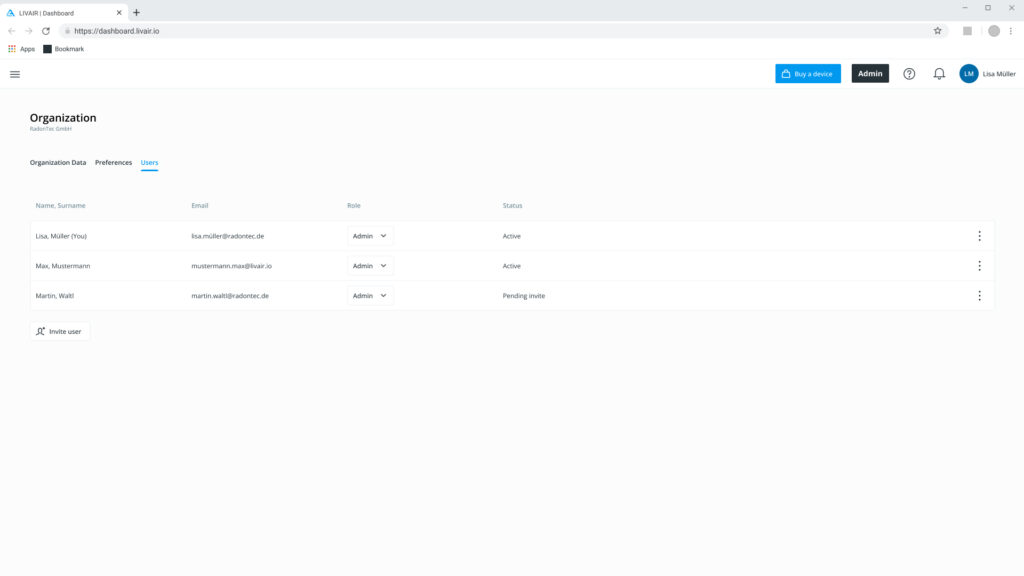

With the help of user management, companies can assign different roles and therefore different rights to their employees. This enables simple control of actions and visibility across multiple users.
The Air Quality Guide (AQG) is designed to help users quickly and easily classify their measured air values on a scale.
It will inform you about the origin of the relevant air factor, what effects it can have on your health and well-being and give you some general improvement measures that can work if you don't have complex problems.

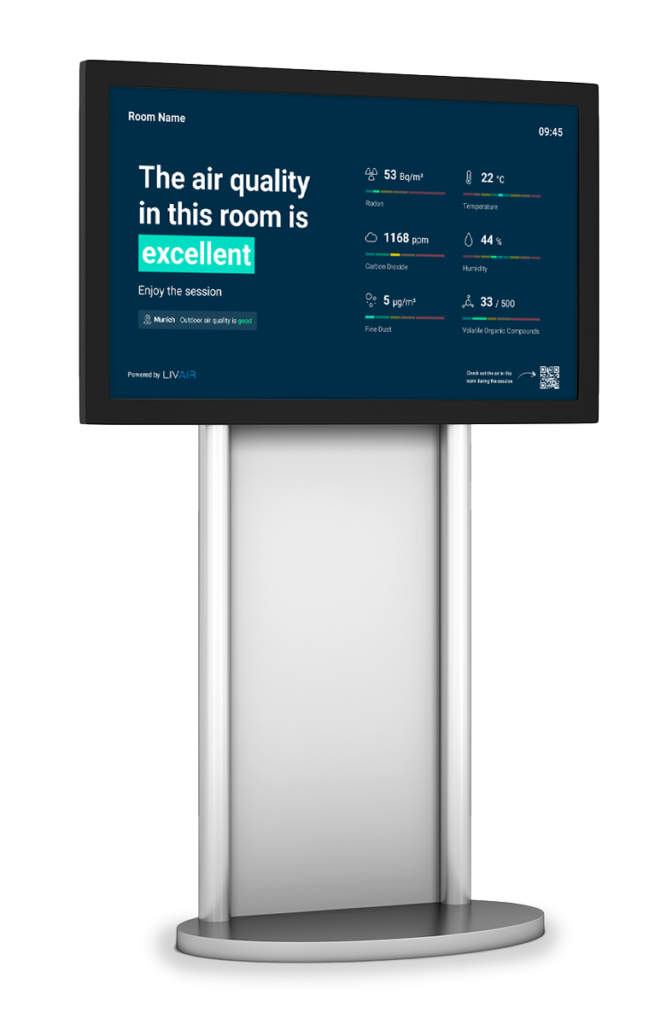
In development
Kiosk mode is a great way to display various air factors in real time on a larger screen, such as a smart TV or monitor, to show a wider audience how good your air quality is.
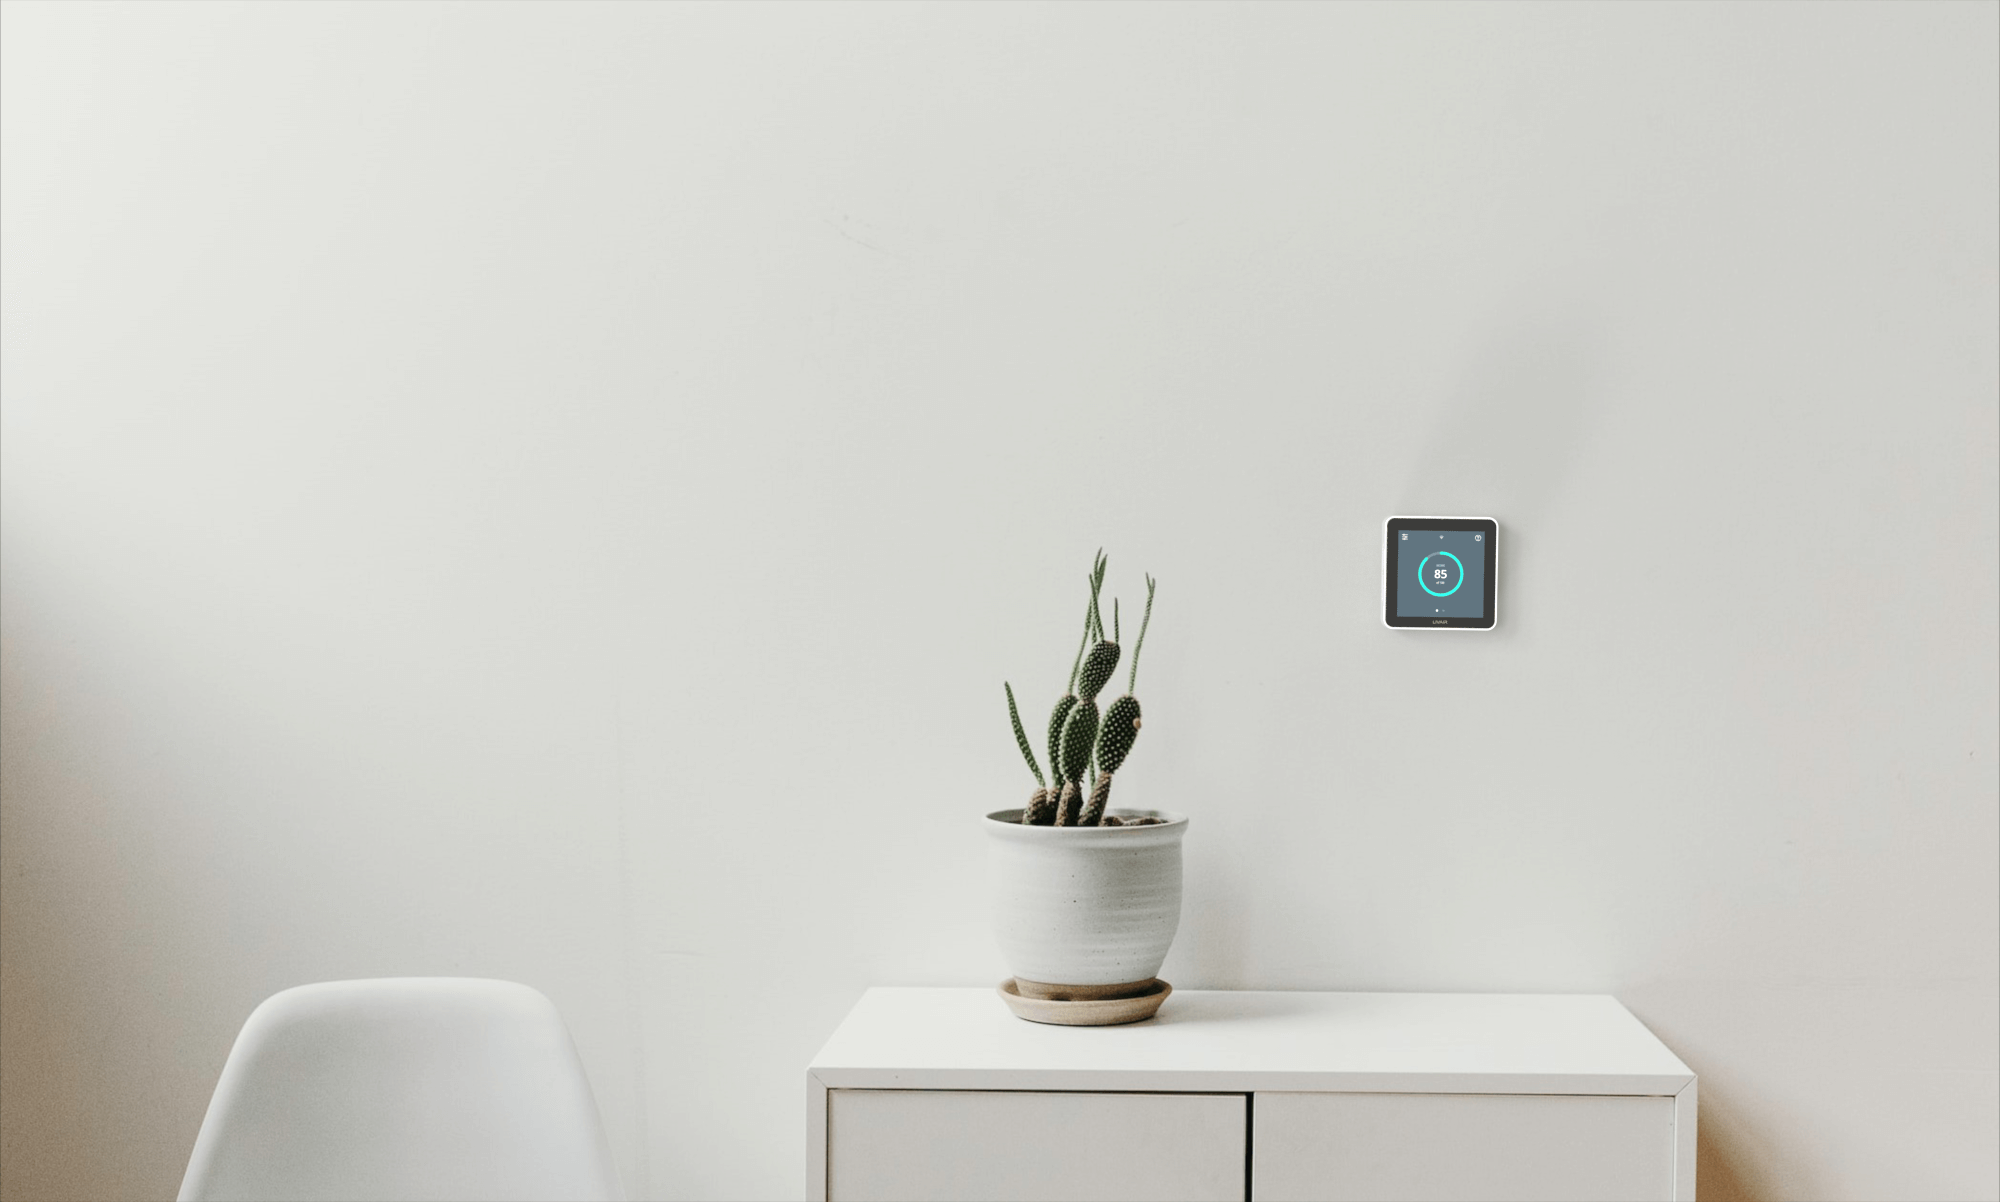
Sensor device
Place your sensor on a shelf or mount it on the wall, connect it to the power supply and start measuring.
Connect your sensor via Wi-Fi or use the integrated SIM card (optional) to send your data to the cloud.
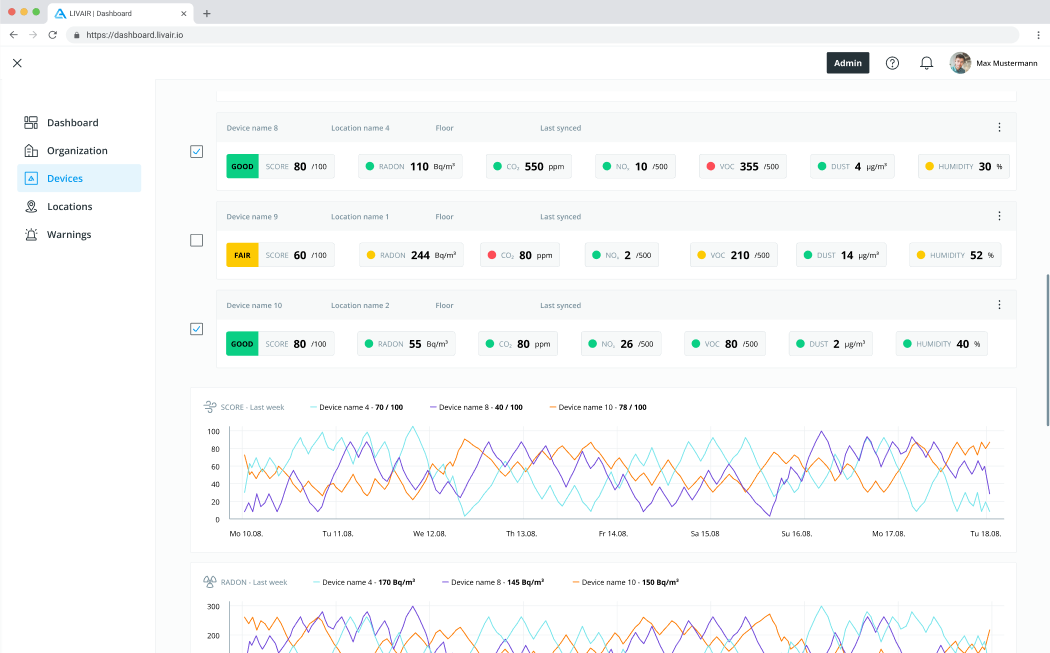
Insights into data
Register and log in to the LivAir Dashboard and add your device to view, compare and manage your data over time.
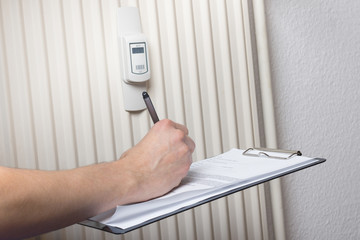
Recommendations
The data can be evaluated and interpreted after just a short time. We help you with the evaluation and possible improvement measures.
The LivAir monitor is equipped with a variety of sensors. The centerpiece is our patented radon sensor.
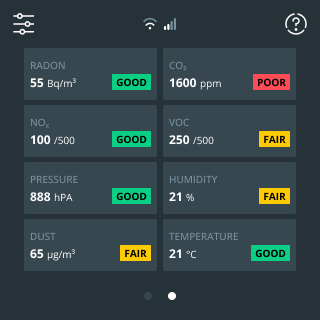
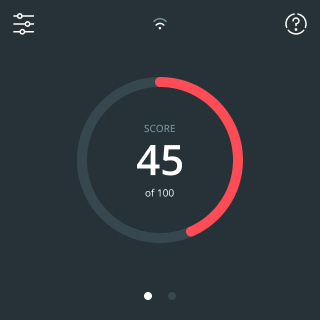
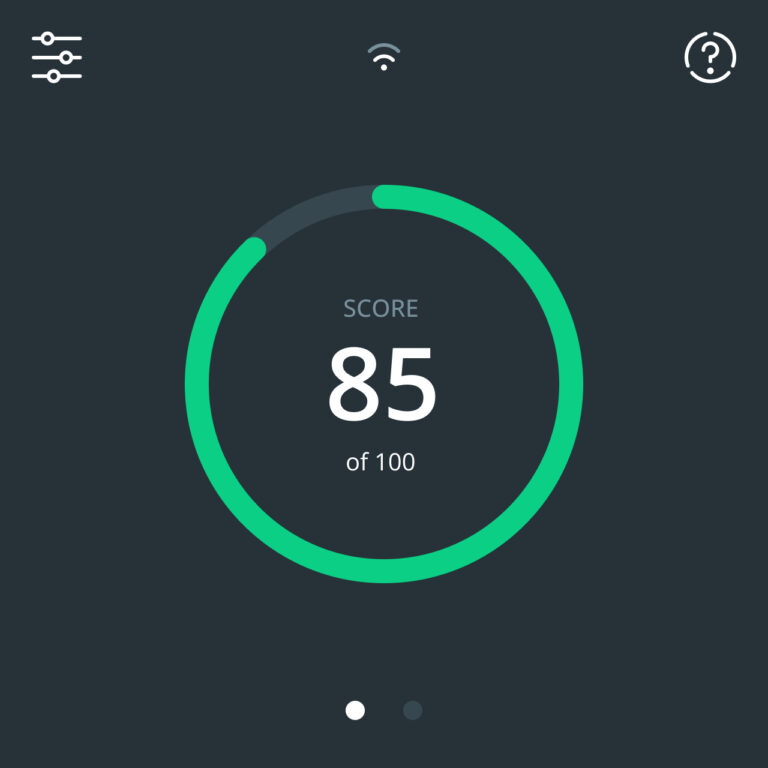
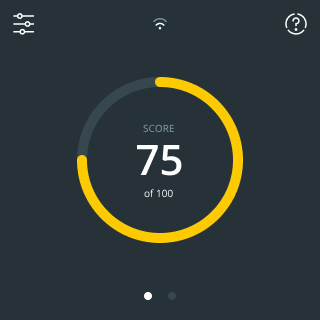

Take a look at how Livair ensures better indoor air.
